Daily Market Screener Analysis, Technical Setups & Momentum Breakouts – October 27, 2026
Institutional daily market screening across the S&P 100 universe for October 27, 2026. Analysis covers macroeconomic catalysts, FOMC positioning, fresh momentum breakouts in TSLA, trend continuation leaders, and volatility-adjusted ATR support/resistance brackets.
1. Executive Macro Overview & Morning Catalysts
Wall Street navigated a pivotal crosscurrent of resilient macroeconomic prints, heightened corporate earnings releases, and opening deliberations of the Federal Open Market Committee’s (FOMC) two-day monetary policy meeting this Tuesday, October 27, 2026. With Federal Reserve officials observing their traditional pre-rate-decision communication blackout, market participants focused acutely on incoming economic activity data to gauge interest rate trajectories and economic durability.
Morning macro indicators delivered upside momentum across key touchpoints. U.S. Advance Durable Goods Orders expanded +1.8% MoM in September, topping consensus estimates (+1.7%) and signaling stable commercial capital expenditure. This was reinforced by a surge in the Conference Board Consumer Confidence Index, which climbed to 91.7 against expectations of 80.5–81.0. Housing prints mirrored this resilience, with Case-Shiller national home price growth sustaining a +4.3% YoY pace and September New Home Sales accelerating to a 722K annualized rate. While benchmark 10-year Treasury yields held steady in response to the firmer cyclical data, equity markets demonstrated noticeable internal divergence, setting up tactical opportunities for disciplined swing traders and active allocators.
Daily Macroeconomic & Earnings Catalyst Schedule
| Ticker / Asset | Event Type | Scheduled Release Time | Expected Impact | Key Market Focus |
|---|---|---|---|---|
| USD / Equities | Macro: Durable Goods & CB Consumer Confidence | Oct 27, 2026 (Reported) | High | Consumer confidence surge (91.7) and resilient core capex reaffirm economic expansion ahead of FOMC. |
| FED / Rates | Macro: FOMC 2-Day Policy Deliberations | Oct 27–28, 2026 | Extreme | Two-day policy rate setting; market pricing focuses on forward guidance, rate path expectations, and QT pacing. |
| V (Visa Inc.) | Corporate Earnings: Q4 FY26 | Oct 27, 2026 (After Close) | High | Consensus EPS $3.44 on $12.09B revenue; key gauge for consumer spending velocity and cross-border volume. |
| KO (Coca-Cola) | Corporate Earnings: Q3 FY26 | Oct 27, 2026 (Pre-Market) | Medium | Pricing elasticity, emerging market volume growth, and organic revenue run-rates in consumer staples. |
| UPS (United Parcel Service) | Corporate Earnings: Q3 FY26 | Oct 27, 2026 (Pre-Market) | Medium-High | Domestic parcel velocity, labor contract absorption, and forward B2B freight outlook heading into peak season. |
| MSFT (Microsoft) | Corporate Earnings: Q1 FY27 | Oct 28, 2026 (After Close) | Extreme | Azure cloud revenue acceleration, AI enterprise monetization, and hyperscale data center capital expenditure. |
| GOOGL (Alphabet) | Corporate Earnings: Q3 FY26 | Oct 28, 2026 (After Close) | Extreme | Search ad spend stability, YouTube monetization trajectory, and cloud operating margin expansion. |
| AMZN (Amazon) | Corporate Earnings: Q3 FY26 | Oct 29, 2026 (After Close) | Extreme | AWS cloud re-acceleration, retail logistics efficiencies, and holiday quarter operating income guidance. |
| LLY (Eli Lilly) | Corporate Earnings: Q3 FY26 | Oct 29, 2026 (Pre-Market) | High | Incretin franchise production scalability, global commercial uptake, and pharmaceutical margin structure. |
2. Market Overview & Trend Shift Screener Results
Technical performance across the S&P 100 mega-cap equity universe reveals a market marked by tactical rotation rather than synchronized broad-market participation. Growth leadership demonstrated notable bifurcation: select consumer and semiconductor names exhibited aggressive accumulation, while enterprise software and communication bellwethers encountered short-term distribution.
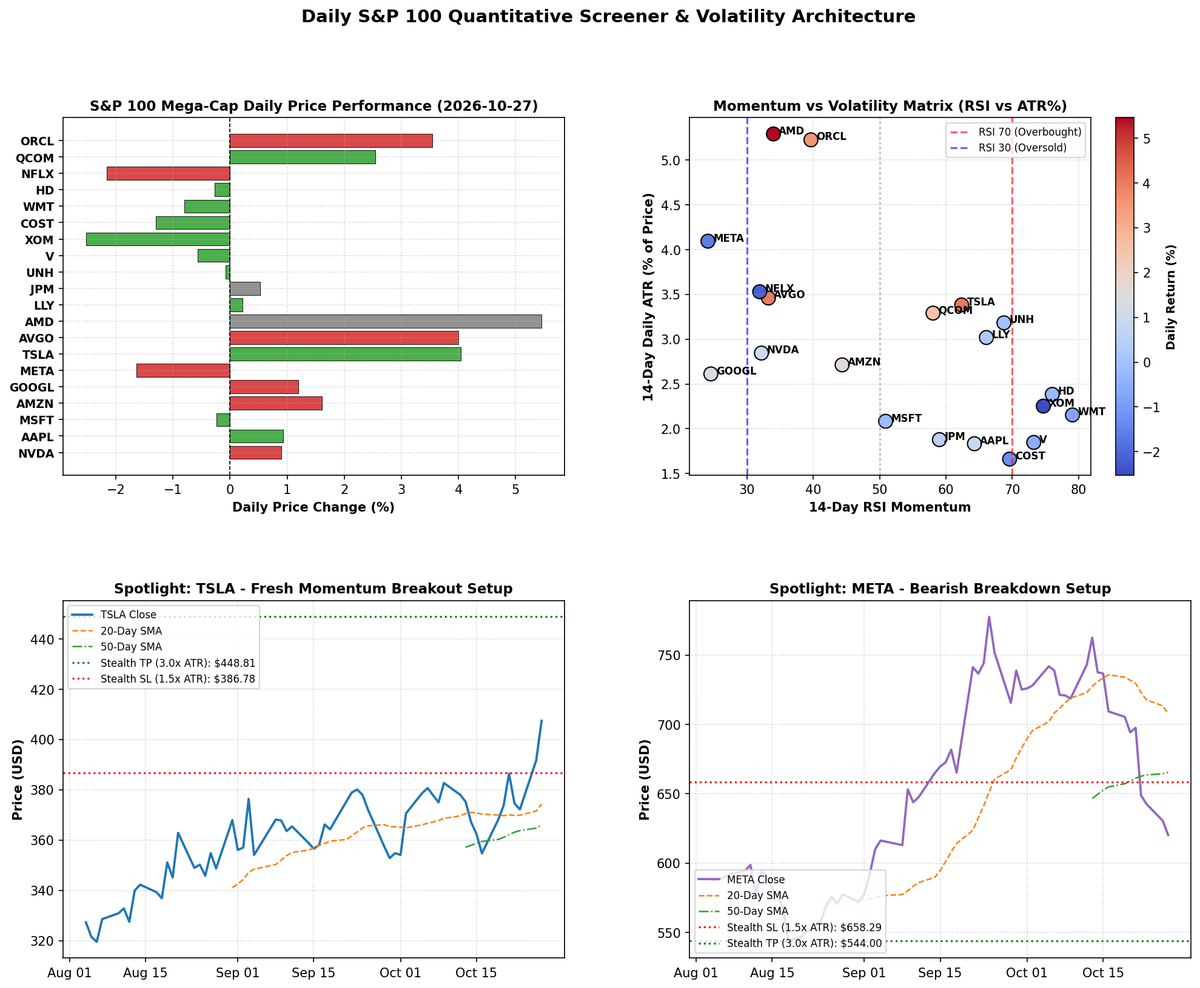
To identify high-conviction structural shifts, our screening engine models daily 20-day and 50-day moving average (SMA) alignments, 14-day Relative Strength Index (RSI) momentum, and 14-day Average True Range (ATR) volatility bands. Key reference brackets are calculated using institutional 1.5x ATR trailing support (Stealth Stop-Loss) and 3.0x ATR expansion targets (Stealth Take-Profit) to maintain a baseline 1:2.0 risk-reward profile.

Quantitative Screener & Volatility Reference Brackets
Note: All metrics computed over daily price action as of October 27, 2026. Brackets reflect 1.5x ATR downside buffer and 3.0x ATR upside target for bullish setups (inverted for bearish structures).
| Ticker | Price ($) | Daily Chg (%) | 14-D RSI | 14-D ATR ($) | ATR Vol (%) | Setup Classification | Bias | Stealth SL ($) | Stealth TP ($) | R/R Ratio |
|---|---|---|---|---|---|---|---|---|---|---|
| TSLA | $407.46 | +4.04% | 62.38 | $13.78 | 3.38% | Fresh Momentum Breakout | Bullish | $386.78 | $448.81 | 1:2.0 |
| AAPL | $347.10 | +0.93% | 64.31 | $6.36 | 1.83% | Bullish Continuation | Bullish | $337.56 | $366.18 | 1:2.0 |
| LLY | $1,281.91 | +0.22% | 66.11 | $38.70 | 3.02% | Bullish Continuation | Bullish | $1,223.86 | $1,398.01 | 1:2.0 |
| UNH | $410.39 | -0.08% | 68.76 | $13.06 | 3.18% | Bullish Continuation | Bullish | $390.80 | $449.58 | 1:2.0 |
| V | $401.86 | -0.57% | 73.26 | $7.42 | 1.85% | Bullish Continuation | Bullish | $390.73 | $424.12 | 1:2.0 |
| QCOM | $184.17 | +2.54% | 58.06 | $6.06 | 3.29% | Bullish Continuation | Bullish | $175.08 | $202.36 | 1:2.0 |
| MSFT | $531.33 | -0.24% | 50.92 | $11.07 | 2.08% | Consolidation Watch | Bullish | $514.73 | $564.53 | 1:2.0 |
| AMD | $560.26 | +5.45% | 33.99 | $29.65 | 5.29% | Mean Reversion Bounce | Neutral | $515.78 | $649.22 | 1:2.0 |
| JPM | $335.79 | +0.52% | 59.03 | $6.31 | 1.88% | Range-Bound Consolidation | Bullish | $326.33 | $354.71 | 1:2.0 |
| NVDA | $217.94 | +0.90% | 32.18 | $6.20 | 2.84% | Oversold Stabilization | Bearish | $227.24 | $199.34 | 1:2.0 |
| AMZN | $253.10 | +1.61% | 44.35 | $6.87 | 2.71% | Bearish Trend Continuation | Bearish | $263.40 | $232.50 | 1:2.0 |
| GOOGL | $320.58 | +1.19% | 24.56 | $8.37 | 2.61% | Bearish Trend Continuation | Bearish | $333.14 | $295.46 | 1:2.0 |
| AVGO | $342.33 | +4.00% | 33.24 | $11.84 | 3.46% | Bearish Trend Continuation | Bearish | $360.10 | $306.80 | 1:2.0 |
| ORCL | $130.53 | +3.55% | 39.65 | $6.82 | 5.22% | Bearish Trend Continuation | Bearish | $140.77 | $110.06 | 1:2.0 |
| META | $620.19 | -1.64% | 24.11 | $25.40 | 4.10% | Bearish Breakdown | Bearish | $658.29 | $543.00 | 1:2.0 |
| NFLX | $62.52 | -2.16% | 31.92 | $2.21 | 3.53% | Bearish Breakdown | Bearish | $65.83 | $55.90 | 1:2.0 |
3. Tactical Setup & Momentum Spotlights
1. Fresh Bullish Breakouts (High Relative Strength)
Tesla Inc. (TSLA) — Multi-Week High Expansion: TSLA registered today’s strongest breakout profile among top-tier liquid equities, rallying +4.04% to close at $407.46 after printing an intraday high of $408.29. The move decisively clears the prior 20-day resistance band, backed by a clean upward expansion in the 14-day RSI to 62.38. With daily ATR expanding to $13.78 (3.38% of spot), volatility buyers have established clear structural control. The technical invalidation level sits at $386.78 (1.5x ATR below spot), while the natural liquidity expansion objective extends toward $448.81.
2. Momentum Leaders & Trend Continuation
Apple Inc. (AAPL) & Eli Lilly & Co. (LLY): Both names continue to exhibit pristine textbook trend structure (Price > 20-day SMA > 50-day SMA). AAPL advanced +0.93% to $347.10 with an RSI of 64.31 and low daily ATR volatility of 1.83% ($6.36), illustrating persistent institutional accumulation with minimal overhead supply. LLY held firm at $1,281.91 (+0.22%, RSI 66.11), consolidating near record highs ahead of Thursday’s earnings release. Meanwhile, Visa (V) closed at $401.86 ahead of its after-market earnings report, carrying strong structural momentum (RSI 73.26) but flashing short-term overbought conditions that warrant patient pullback execution rather than chasing gap extensions.
3. Bearish Trend Continuations & Relative Weakness
Meta Platforms (META) & Netflix (NFLX) — Support Violations: In sharp contrast to consumer discretionary strength, META experienced acute selling pressure, declining -1.64% to $620.19. The stock decisively sliced below its 20-day and 50-day moving averages, driving its 14-day RSI down to an oversold 24.11 with an elevated daily ATR of $25.40 (4.10% of price). The technical breakdown establishes dynamic resistance between $645.00 and $658.00. Similarly, NFLX fell -2.16% to $62.52, confirming a breakdown below its 20-day consolidation channel with RSI sinking to 31.92.
4. Volatility Compression / Consolidation Watch
Microsoft (MSFT) & JPMorgan Chase (JPM): MSFT traded virtually flat (-0.24% at $531.33) with RSI pegged at neutral 50.92 and daily ATR compressed to 2.08% ($11.07). The equity is coil-compressing between its 20-day SMA ($526.40) and 50-day SMA ($518.90) directly ahead of Wednesday afternoon’s Q1 earnings release, setting the stage for a volatility breakout once hyperscale cloud metrics cross the tape. JPM continues to carve out an orderly post-earnings consolidation range around $335.79, anchored by steady bank sector liquidity.
4. Daily Market Outlook & Tactical Takeaways
As the session closes and after-hours earnings roll in, market participants face a catalyst-dense 48-hour window dominated by the FOMC policy rate decision tomorrow afternoon and mega-cap tech earnings reports from Microsoft, Alphabet, Amazon, and Eli Lilly. Here are the core tactical takeaways for active market navigators:
- Respect Volatility Asymmetry: With market breadth polarized between breakout names (TSLA, QCOM, AAPL) and distributing tech giants (META, NFLX), avoid broad-brush index beta exposure. Focus capital on names exhibiting verifiable relative strength and clear moving average alignment.
- Anchor Stops Beyond Daily Noise: With earnings catalysts and central bank rate decisions converging, intraday whipsaws are elevated. Utilize ATR-calibrated stop brackets (minimum 1.5x daily ATR buffer) to avoid premature invalidation from morning liquidity sweeps.
- Manage Pre-Earnings Binary Risk: Entering swing positions directly ahead of after-hours releases exposes accounts to unmanageable gap risk. Where exposure is held through binary releases, position sizing should be dialed down to account for implied volatility crush and post-market spread expansion.
DISCLAIMER & TERMS OF USE:
This article is published as part of a general market news and quantitative research series for readers interested in economic and market trends. It is not, and should not be construed as, investment advice, financial advice, trading advice, or a solicitation to buy or sell any financial instruments or securities. Financial markets involve significant risk, and historical market behavior is not indicative of future results. Readers are advised to consult qualified financial professionals before making any financial or investment decisions.