Daily Market Screener Analysis, Technical Setups & Momentum Breakouts – October 25, 2026
Daily quantitative screener across top liquid S&P 100 leaders revealing key trend shifts, momentum breakouts, and technical risk brackets ahead of peak Q3 earnings.
As global equity markets gear up for the most consequential earnings week of the autumn calendar, cross-asset dispersion across US large-caps is widening significantly. While defensive bastions and energy leaders establish fresh upward momentum regimes, high-beta semiconductor and mega-cap tech names are experiencing selective liquidation, opening up distinct technical divergences across liquid institutional equities.
1. Executive Macro Overview & Morning Catalysts
Heading into the final week of October 2026, market participants are navigating a multifaceted macro landscape defined by shifting treasury yield curves, impending Q3 GDP estimates, and high-stakes corporate quarterly earnings reports. Benchmark 10-year US Treasury yields continue to oscillate around key inflection zones, exerting valuation pressure on long-duration technology equities while bolstering capital flows toward cash-flow-generative value franchises.
The upcoming five-day economic window features decisive growth data alongside critical inflation metrics. Core PCE deflator updates and advance Q3 GDP readings will offer pivotal validation on whether consumer resilience remains intact or whether decelerating capital expenditure is beginning to bite. Simultaneously, pre-election positioning ahead of the November legislative elections has introduced an elevated volatility premium into index futures contracts.
The table below summarizes the key macroeconomic releases and high-impact mega-cap earnings announcements scheduled to dictate cross-asset volatility across the upcoming trading sessions:
| Ticker / Asset | Event Type | Scheduled Release Time | Expected Impact | Key Market Focus |
|---|---|---|---|---|
| SPY / QQQ / DXY | US Advance Q3 GDP & Core PCE | Wed–Thu, Oct 28–29 (08:30 ET) | High | Soft-landing verification vs. growth deceleration; core services inflation trajectory dictating Fed terminal rate expectations. |
| US 10Y / USD | FOMC Pre-Meeting Communications | Mon–Wed, Oct 26–28 | Medium–High | Rate-path forward guidance, financial conditions loosening/tightening, and quantitative tightening balance sheet runoff pace. |
| V | Q3 FY26 Earnings Report | Tuesday, Oct 27 (Post-Market) | Medium | Consumer payment volume growth, cross-border payment resiliency, and discretionary consumer transaction velocity. |
| MSFT | Q1 FY27 Earnings Report | Wednesday, Oct 28 (Post-Market) | Very High | Azure cloud revenue acceleration, enterprise Copilot AI monetization run-rates, and infrastructure CapEx expansion. |
| GOOGL | Q3 2026 Earnings Report | Wednesday, Oct 28 (Post-Market) | Very High | Google Cloud operating margins, YouTube ad revenue durability, Gemini model monetization, and regulatory antitrust overhead. |
| AMZN | Q3 2026 Earnings Report | Thursday, Oct 29 (Post-Market) | Very High | AWS enterprise cloud workload backlog, holiday quarter operating margin guidance, and fulfillment logistics cost efficiencies. |
| LLY | Q3 2026 Earnings Report | Thursday, Oct 29 (Pre-Market) | High | GLP-1 manufacturing capacity scaling, international demand curves, and cardiometabolic clinical pipeline milestones. |
| XOM | Q3 2026 Earnings Report | Friday, Oct 30 (Pre-Market) | High | Upstream crude price realizations, refining margin capture, Pioneer Natural Resources asset synergies, and capital returns. |
2. Market Overview & Trend Shift Screener Results
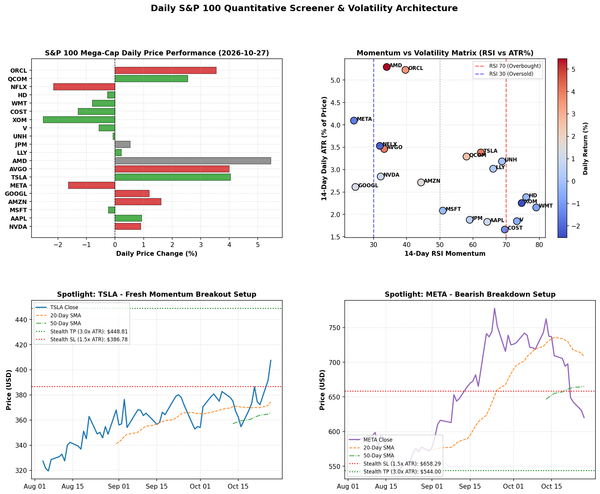
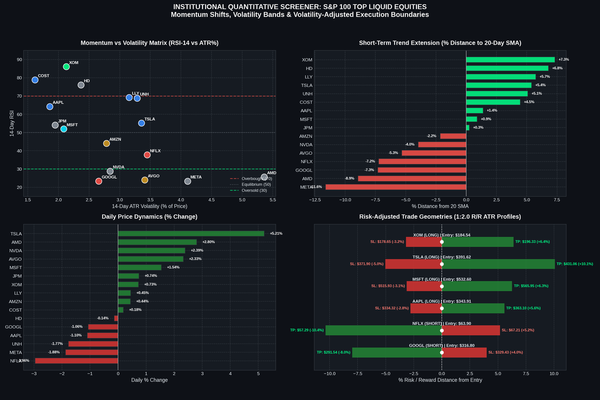
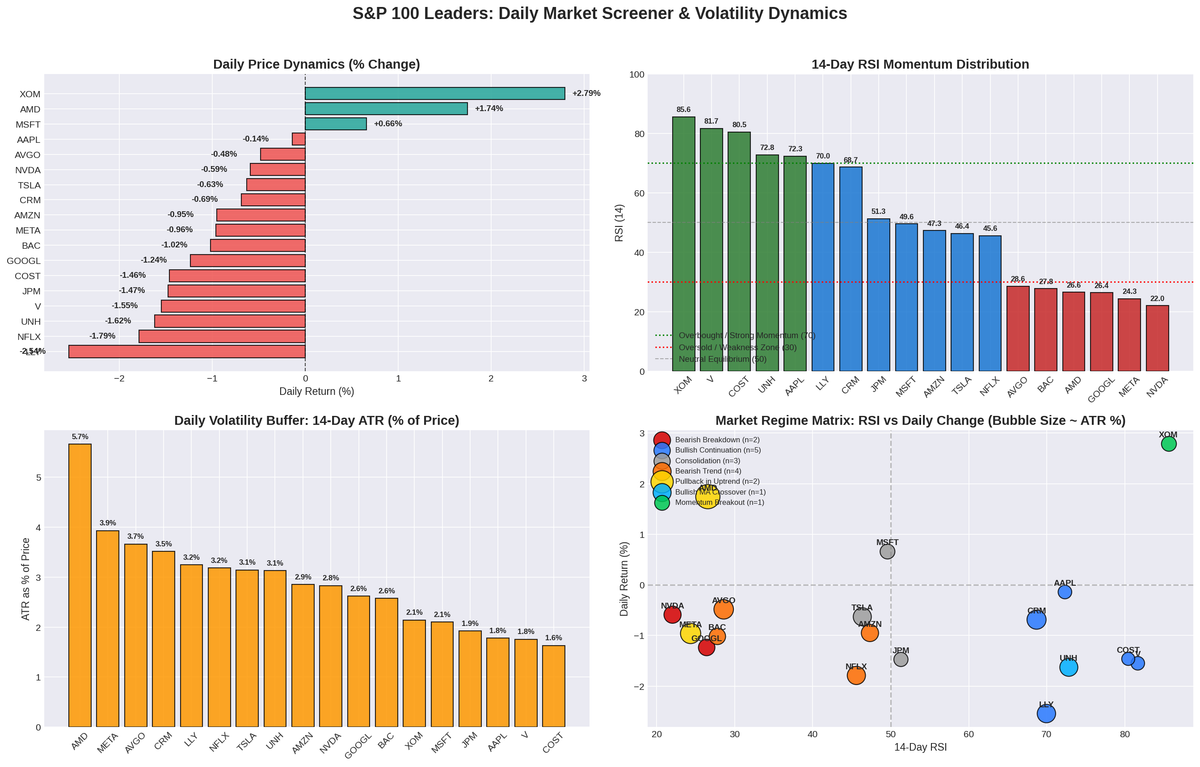
To pinpoint clear short-term momentum shifts and relative strength anomalies, our quantitative engine evaluated 18 benchmark equities across the S&P 100 universe. The scanning framework focuses on 20-day versus 50-day Simple Moving Average (SMA) alignment, 14-day Relative Strength Index (RSI) momentum readings, daily price changes, and 14-day Average True Range (ATR) volatility bands.
The daily scan highlights notable sector rotation. Capital has rotated aggressively into Energy (XOM) and Healthcare (UNH, LLY), while select defensive compounders (COST, V, AAPL) demonstrate disciplined accumulation patterns. In contrast, heavy-weight semiconductor leaders (NVDA, AVGO, AMD) and communication giants (GOOGL, META) have retreated into structural oversold pullbacks or technical breakdown territory, testing vital intermediate trend floors.
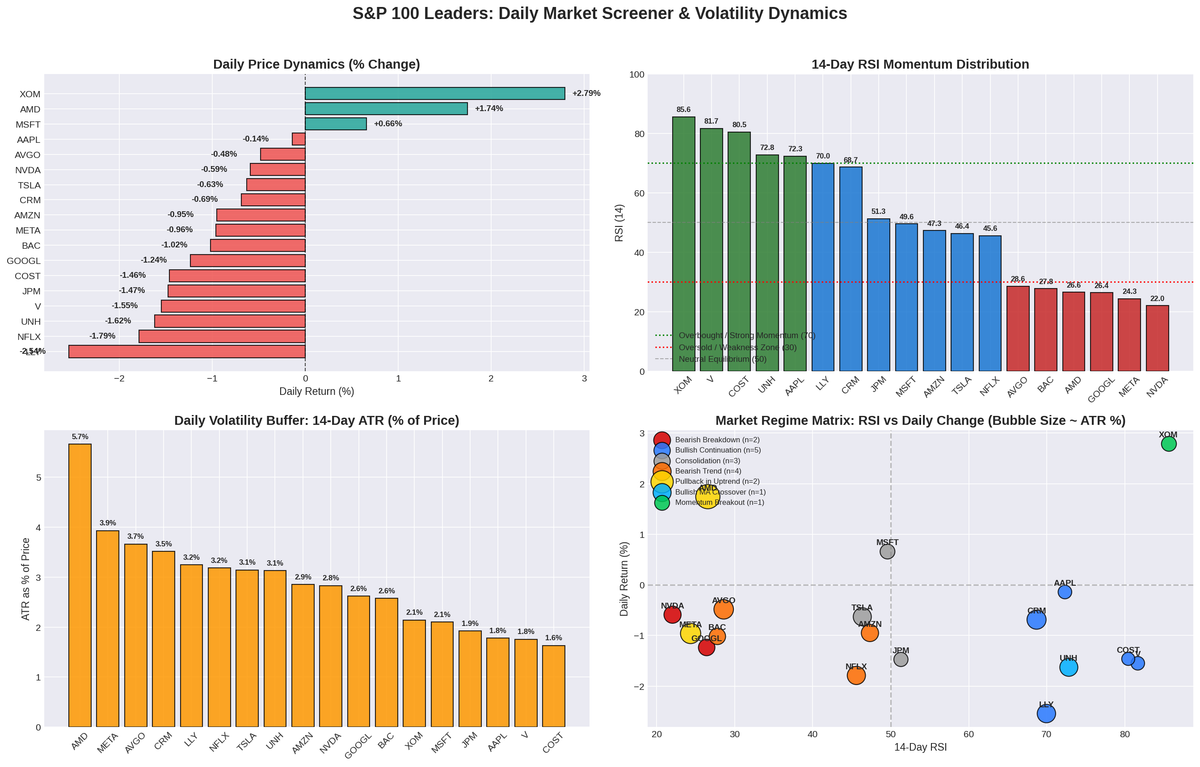
Below is the complete multi-metric quantitative screener matrix. Stealth technical support (Stop-Loss) brackets are modeled at 1.5× ATR(14), while upside expansion benchmarks (Take-Profit) are modeled at 3.0× ATR(14), anchoring a structural 2.0:1 Reward-to-Risk profile:
| Ticker | Price | Daily Chg % | 14-D RSI | 14-D ATR | ATR Vol % | Setup Classification | Bias | Stealth SL (1.5x ATR) | Stealth TP (3.0x ATR) | R/R Ratio |
|---|---|---|---|---|---|---|---|---|---|---|
| XOM | $183.21 | +2.79% | 85.6 | $3.93 | 2.1% | Momentum Breakout | Bullish | $177.32 | $194.99 | 2.0:1 |
| UNH | $418.09 | -1.62% | 72.8 | $13.08 | 3.1% | Bullish MA Crossover | Bullish | $398.46 | $457.34 | 2.0:1 |
| AAPL | $347.73 | -0.14% | 72.3 | $6.19 | 1.8% | Bullish Continuation | Bullish | $338.45 | $366.29 | 2.0:1 |
| V | $407.92 | -1.55% | 81.7 | $7.18 | 1.8% | Bullish Continuation | Bullish | $397.15 | $429.46 | 2.0:1 |
| COST | $1,003.32 | -1.46% | 80.5 | $16.40 | 1.6% | Bullish Continuation | Bullish | $978.72 | $1,052.53 | 2.0:1 |
| LLY | $1,273.46 | -2.54% | 70.0 | $41.34 | 3.2% | Bullish Continuation | Bullish | $1,211.45 | $1,397.47 | 2.0:1 |
| CRM | $248.57 | -0.69% | 68.7 | $8.74 | 3.5% | Bullish Continuation | Bullish | $235.46 | $274.79 | 2.0:1 |
| META | $642.62 | -0.96% | 24.3 | $25.28 | 3.9% | Pullback in Uptrend | Mean Reversion | $604.69 | $718.47 | 2.0:1 |
| AMD | $516.79 | +1.74% | 26.6 | $29.27 | 5.7% | Pullback in Uptrend | Mean Reversion | $472.88 | $604.61 | 2.0:1 |
| MSFT | $524.51 | +0.66% | 49.6 | $11.04 | 2.1% | Consolidation | Neutral | $507.95 | $557.63 | 2.0:1 |
| JPM | $331.58 | -1.47% | 51.3 | $6.37 | 1.9% | Consolidation | Neutral | $322.02 | $350.69 | 2.0:1 |
| TSLA | $372.22 | -0.63% | 46.4 | $11.70 | 3.1% | Consolidation | Neutral | $354.67 | $407.32 | 2.0:1 |
| AMZN | $248.00 | -0.95% | 47.3 | $7.08 | 2.9% | Bearish Trend | Bearish | $258.63 | $226.75 | 2.0:1 |
| NFLX | $65.85 | -1.79% | 45.6 | $2.10 | 3.2% | Bearish Trend | Bearish | $68.99 | $59.56 | 2.0:1 |
| AVGO | $321.68 | -0.48% | 28.6 | $11.79 | 3.7% | Bearish Trend | Bearish | $339.36 | $286.31 | 2.0:1 |
| BAC | $50.56 | -1.02% | 27.8 | $1.30 | 2.6% | Bearish Trend | Bearish | $52.51 | $46.65 | 2.0:1 |
| GOOGL | $320.21 | -1.24% | 26.4 | $8.39 | 2.6% | Bearish Breakdown | Bearish | $332.79 | $295.05 | 2.0:1 |
| NVDA | $210.96 | -0.59% | 22.0 | $5.98 | 2.8% | Bearish Breakdown | Bearish | $219.93 | $193.03 | 2.0:1 |
3. Tactical Setup & Momentum Spotlights
1. Fresh Bullish Breakouts & Relative Strength Leaders
Exxon Mobil (XOM) – Energy Breakout in High Gear:
Exxon Mobil posted the standout technical performance of the screening universe, advancing +2.79% to $183.21 on heavy institutional volume. The move decisively clears its prior 20-day swing highs, propelled by strong crack spreads and energy asset consolidation. Price is trending well above both its rising 20-day ($170.85) and 50-day ($165.76) moving averages. While an elevated 14-day RSI (85.6) indicates overbought conditions, strong trend momentum often persists when backed by sector rotation. Key support rests at $177.32 (1.5× ATR), with overhead Fibonacci extension targets pointing toward $194.99.
UnitedHealth Group (UNH) – Confirmed Golden Cross:
UnitedHealth printed a textbook bullish trend shift as its 20-day SMA ($389.21) completed an upward crossover above its 50-day SMA ($387.60). Although closing down -1.62% on the session at $418.09 due to minor intraday profit-taking, UNH preserves a robust bullish momentum score (RSI 72.8). The crossover confirms an intermediate trend reversal following months of healthcare consolidation. Technical support is anchored at $398.46, with upside continuation targets extending toward $457.34.
2. Momentum Leaders & Trend Continuation Franchises
Apple (AAPL) & Visa (V) – Disciplined Upward Price Discovery:
Apple ($347.73) and Visa ($407.92) exemplify high-quality trend continuation. Both tickers exhibit tight price compression near record territories, trading comfortably above their respective 20-day and 50-day moving averages with moderate volatility (ATR under 1.9% of share price). For Apple, the consolidation above $345 sets the foundation for a test of $366, with strong underlying support at $338.45. Visa presents a parallel pattern ahead of earnings, flanked by an ATR support floor at $397.15 and upside targets at $429.46.
Costco Wholesale (COST) – Elite Compounder Resilience:
Costco ($1,003.32) remains anchored above the four-digit milestone, supported by strong retail foot traffic and membership renewal metrics. The 20-day SMA ($958.15) and 50-day SMA ($938.86) remain in bullish alignment, while an ATR band of $16.40 (1.6% volatility) reflects exceptional institutional stability. Structural support rests at $978.72, with upside extension targets marked at $1,052.53.
3. Bearish Trend Continuations & Relative Weakness Profiles
Nvidia (NVDA) – Distribution Below Swing Lows:
Nvidia closed at $210.96, slipping below its 20-day ($225.54) and 50-day ($222.39) moving averages. The 14-day RSI has dropped to 22.0, reflecting sharp sector liquidation as institutional desks rotate capital from hardware suppliers into cash-flow leaders. While severely oversold on an intraday basis, trend continuation models project downside targets toward $193.03, with overhead resistance capped at $219.93.
Alphabet (GOOGL) – Structural Breakdown Ahead of Earnings:
Alphabet ($320.21) broke beneath its 20-day low with RSI registering 26.4. The technical breakdown reflects mounting headline sensitivity regarding cloud capital expenditures and search margin pressures. Rallies toward $332.79 face heavy institutional supply, with the 3.0× ATR extension pointing toward lower liquidity pools at $295.05.
4. Volatility Compression & Mean Reversion Watch
Meta Platforms (META) & Advanced Micro Devices (AMD):
Both META ($642.62, RSI 24.3) and AMD ($516.79, RSI 26.6) have experienced steep short-term flushes into deeply oversold territory, yet both remain structurally situated near their primary 50-day moving averages ($663.58 and $542.28, respectively). These compressed regimes present classic mean-reversion characteristics for nimble traders looking for corrective bounces toward moving average equilibriums, provided tight support brackets at $604.69 (META) and $472.88 (AMD) hold firm.
4. Daily Market Outlook & Tactical Takeaways
As trading desks prepare for the week ahead, the overarching market dynamic is characterized by tactical rotation rather than broad-based systemic liquidation. Value, energy, and healthcare equities are actively absorbing the capital departing high-valuation semiconductor and digital advertising bellwethers.
Key Tactical Principles for the Week Ahead:
- Respect Relative Strength Anomalies: Maintain long focus on names exhibiting positive RSI momentum and rising moving average stacks (XOM, UNH, COST, V) while avoiding premature dip-buying in accelerating downtrends (NVDA, GOOGL) until momentum divergence confirms.
- Manage Earnings Gap Vulnerabilities: With mega-caps reporting in rapid succession (MSFT, GOOGL, AMZN, LLY, XOM), position sizing should strictly accommodate overnight gap risk and implied volatility adjustments.
- Anchor Exits to Volatility Bands: Utilizing structured 1.5× ATR support thresholds and 3.0× ATR profit targets maintains mathematical expectancy across shifting market regimes, avoiding emotional decision-making amid earnings-induced whipsaws.
The stage is set for a pivotal week of price discovery. Keeping exposure calibrated to verified trend structures and volatility brackets will remain the paramount edge for institutional and disciplined retail market participants alike.
DISCLAIMER & TERMS OF USE:
This article is published as part of a general market news and quantitative research series for readers interested in economic and market trends. It is not, and should not be construed as, investment advice, financial advice, trading advice, or a solicitation to buy or sell any financial instruments or securities. Financial markets involve significant risk, and historical market behavior is not indicative of future results. Readers are advised to consult qualified financial professionals before making any financial or investment decisions.