Daily Market Screener Analysis, Technical Setups & Momentum Breakouts – October 26, 2026
Discover the latest market dynamics across the S&P 100 universe for October 26, 2026. Featuring technical momentum shifts in MSFT, breakout expansion in XOM, and volatility-adjusted execution boundaries.
Wall Street kicked off the trading week with pronounced cross-asset dispersion as institutional capital continues to rotate decisively between defensive quality, energy strength, and high-beta mega-cap technology. With the Federal Open Market Committee (FOMC) now officially inside its pre-meeting blackout window and benchmark 10-year Treasury yields stabilizing, market participants are scrutinizing corporate balance sheets and incoming earnings reports to determine the next major leg of equity trend expansion.
Section 1: Executive Macro Overview & Morning Catalysts
Macroeconomic sentiment remains anchored in a state of watchful equilibrium. While headline activity indicators reflect steady consumer demand, underlying divergence between services strength and manufacturing softness persists. Treasury yield volatility has compressed, allowing equity multiples room to breathe; however, with several "Magnificent Seven" heavyweights reporting results this week, short-term positioning risk remains acute.
Below is an overview of the pivotal economic releases and high-impact corporate earnings scheduled to drive liquidity and price discovery throughout today's session and the week ahead:
| Ticker / Asset | Event Type | Scheduled Release | Expected Impact | Key Market Focus |
|---|---|---|---|---|
| MACRO (US) | Initial Jobless Claims & GDP Revision | Thursday Morning (08:30 EDT) | High | Labor market tightness and growth resilience testing neutral Fed rate expectations. |
| MACRO (US) | Core PCE Price Index | Friday Morning (08:30 EDT) | High | Federal Reserve's primary inflation benchmark; key driver for cross-asset liquidity. |
| GOOGL | Q3 Earnings Release | Imminent (Post-Market) | High | Google Cloud revenue run-rate, Search ad elasticity, and GenAI CapEx return. |
| MSFT | Q1 FY27 Earnings Report | Scheduled Oct 28 (Post-Market) | High | Azure cloud expansion, Copilot enterprise monetization, and infrastructure guidance. |
| AMZN | Q3 Earnings Report | Scheduled Oct 29 (Post-Market) | High | AWS enterprise margin resilience, ad business expansion, and logistics efficiency. |
| AAPL | Q4 FY26 Earnings Report | Scheduled Nov 02 (Post-Market) | High | Apple Intelligence hardware refresh cycle and Greater China revenue stabilization. |
| XOM | Q3 Earnings Report | Scheduled Oct 30 (Pre-Market) | Medium | Upstream realization margins, Pioneer asset synergies, and shareholder payouts. |
Section 2: Market Overview & Trend Shift Screener Results
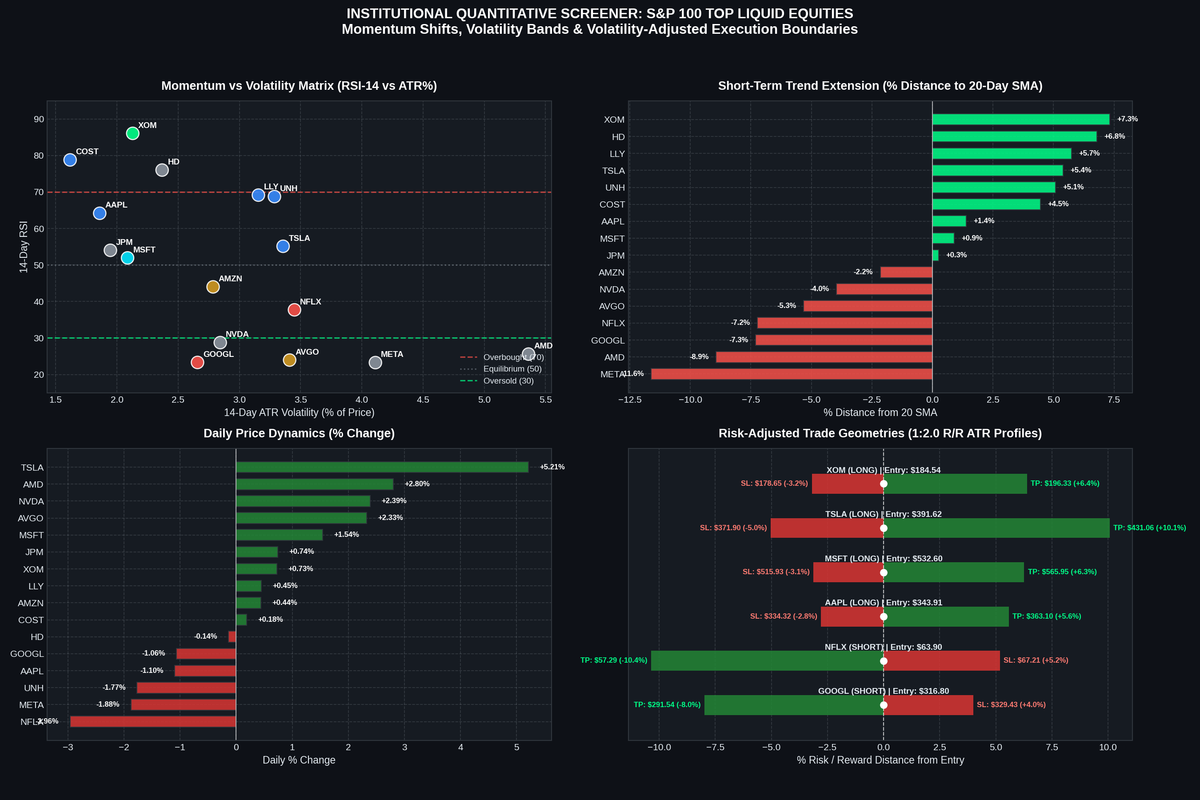
Today's institutional scan across the liquid mega-cap universe reveals an expanding divergence between top-performing market leaders and underperforming structural laggards. While broad indices hover near structural balance, single-stock momentum distributions highlight several high-conviction inflection points.
Technical trend structure is evaluated using 20-day and 50-day Simple Moving Average (SMA) alignment alongside 14-day Relative Strength Index (RSI) momentum and 14-day Average True Range (ATR) volatility bands. Volatility-adjusted risk parameters incorporate a 1.5× ATR stop-loss buffer and a 3.0× ATR upside objective, preserving a mathematically robust 1:2.0 risk-to-reward geometry.
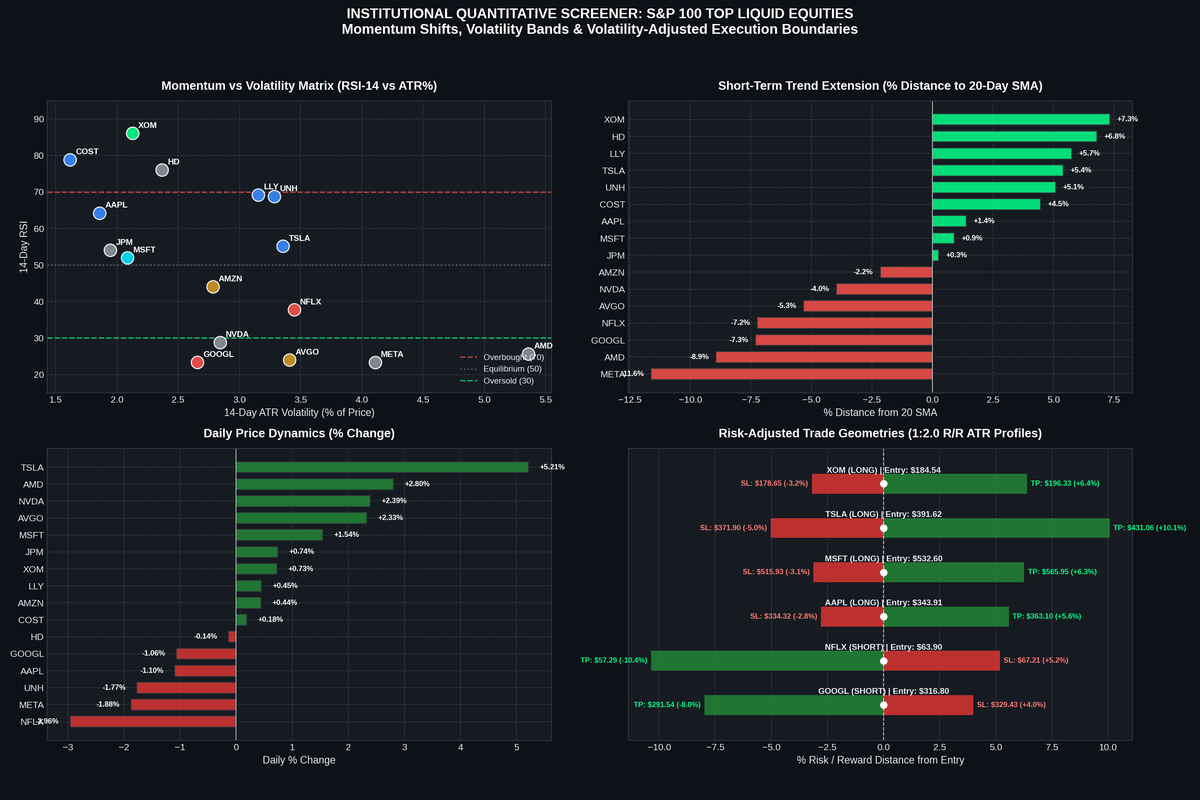
The complete quantitative screening dataset across our core universe is detailed below:
| Ticker | Price | Daily Chg % | 14-D RSI | 14-D ATR | ATR Vol % | Setup Classification | Bias | Stop-Loss (1.5x) | Take-Profit (3.0x) | R/R |
|---|---|---|---|---|---|---|---|---|---|---|
| TSLA | $391.62 | +5.21% | 55.1 | $13.15 | 3.4% | Bullish Continuation | LONG | $371.90 | $431.06 | 1:2.0 |
| MSFT | $532.60 | +1.54% | 51.9 | $11.12 | 2.1% | Bullish Trend Shift | LONG | $515.93 | $565.95 | 1:2.0 |
| XOM | $184.54 | +0.73% | 86.1 | $3.93 | 2.1% | Bullish Breakout | LONG | $178.65 | $196.33 | 1:2.0 |
| LLY | $1,279.14 | +0.45% | 69.1 | $40.36 | 3.2% | Bullish Continuation | LONG | $1,218.60 | $1,400.23 | 1:2.0 |
| COST | $1,005.16 | +0.18% | 78.8 | $16.26 | 1.6% | Bullish Continuation | LONG | $980.77 | $1,053.95 | 1:2.0 |
| AAPL | $343.91 | -1.10% | 64.2 | $6.40 | 1.9% | Bullish Continuation | LONG | $334.32 | $363.10 | 1:2.0 |
| UNH | $410.70 | -1.77% | 68.7 | $13.50 | 3.3% | Bullish Continuation | LONG | $390.45 | $451.19 | 1:2.0 |
| AMD | $531.28 | +2.80% | 25.6 | $28.48 | 5.4% | Neutral / Consolidation | NEUTRAL | $488.55 | $616.73 | 1:2.0 |
| NVDA | $216.00 | +2.39% | 28.7 | $6.14 | 2.8% | Neutral / Consolidation | NEUTRAL | $206.78 | $234.43 | 1:2.0 |
| JPM | $334.04 | +0.74% | 54.0 | $6.50 | 1.9% | Neutral / Consolidation | NEUTRAL | $324.29 | $353.55 | 1:2.0 |
| HD | $319.38 | -0.14% | 76.0 | $7.57 | 2.4% | Neutral / Consolidation | NEUTRAL | $308.03 | $342.08 | 1:2.0 |
| META | $630.56 | -1.88% | 23.3 | $25.92 | 4.1% | Neutral / Consolidation | NEUTRAL | $591.67 | $708.33 | 1:2.0 |
| AVGO | $329.17 | +2.33% | 23.9 | $11.23 | 3.4% | Bearish Continuation | SHORT | $346.01 | $295.49 | 1:2.0 |
| AMZN | $249.09 | +0.44% | 44.0 | $6.94 | 2.8% | Bearish Continuation | SHORT | $259.50 | $228.27 | 1:2.0 |
| GOOGL | $316.80 | -1.06% | 23.3 | $8.42 | 2.7% | Bearish Breakdown | SHORT | $329.43 | $291.54 | 1:2.0 |
| NFLX | $63.90 | -2.96% | 37.7 | $2.20 | 3.5% | Bearish Breakdown | SHORT | $67.21 | $57.29 | 1:2.0 |
Section 3: Tactical Setup & Momentum Spotlights
1. Fresh Bullish Breakouts & Trend Shifts
Microsoft Corp (MSFT) — Trend Inversion Reclaim:
Microsoft printed one of the cleanest structural reversals on the board today, advancing +1.54% to $532.60. The move propelled price back cleanly through both its 20-day SMA ($518.20) and 50-day SMA ($512.45). Crucially, the 14-day RSI reclaimed positive territory at 51.9, signaling the cessation of recent distribution pressure. With an ATR of $11.12, initial downside support aligns at $515.93 (1.5× ATR buffer), opening a technical glide path toward $565.95 prior to earnings.
Exxon Mobil (XOM) — Structural Breakout:
Exxon Mobil continues its persistent multi-week trend expansion, ticking higher by +0.73% to $184.54 and recording fresh multi-week highs. While its 14-day RSI sits at an overextended 86.1, the stock exhibits tight daily ranges (ATR of $3.93, or just 2.1% of price), indicating institutional accumulation rather than climactic buying. Tactical stops calibrate to $178.65, with an upside expansion target near $196.33.
2. Momentum Leaders & Trend Continuation
Tesla (TSLA) — High-Beta Extension:
Tesla led the mega-cap complex with a +5.21% advance to $391.62. The stock continues to display strong relative strength above its short-term moving averages. Volatility remains elevated with an ATR of $13.15 (3.4% of price), framing key support at $371.90 and an institutional projection target at $431.06.
Eli Lilly (LLY) & Costco (COST) — Resilient Quality Outperformance:
Healthcare and defensive consumer leaders continue to attract consistent inflows. LLY ($1,279.14) and COST ($1,005.16) both maintain well-defined upward-sloping moving average channels with 14-day RSIs in comfortable bullish territory (69.1 and 78.8, respectively). These names offer defensive beta in an environment characterized by tech rotation.
3. Bearish Breakdowns & Relative Weakness
Alphabet (GOOGL) — Structural Support Breach:
In contrast to software resilience, Alphabet broke below its 20-day rolling swing low today, slipping -1.06% to $316.80. Trading well below both its 20-day and 50-day SMAs, its 14-day RSI collapsed to 23.3. Immediate overhead resistance rests at $329.43, with structural downside targets tracking toward $291.54 ahead of earnings.
Netflix (NFLX) — Momentum Breakdown:
Netflix experienced sustained distribution, sliding -2.96% to $63.90. The stock triggered a fresh daily breakdown setup, remaining capped under downward-sloping technical moving averages. Key resistance is identified at $67.21, with secondary support aligned near $57.29.
4. Volatility Compression / Consolidation Watch
Semiconductor Complex (NVDA & AMD):
Both Nvidia ($216.00, +2.39%) and AMD ($531.28, +2.80%) logged counter-trend bounces off deeply compressed levels (RSIs at 28.7 and 25.6, respectively). While intraday buyers defended key psychological support, both names remain pinned beneath downward-trending 20-day moving averages. Traders should look for sustained closes above short-term moving average resistance before confirming a macro trend inversion.
Section 4: Daily Market Outlook & Tactical Takeaways
As the week develops, institutional market dynamics will be governed primarily by the intersection of central bank messaging and mega-cap corporate earnings. Key considerations for tactical positioning include:
- Sector Rotation Over Index Direction: The broader market continues to operate in a rotational regime rather than a synchronized directional trend. Capital is actively flowing out of vulnerable high-multiple technology and into energy, defensive healthcare, and select software platforms that exhibit pricing power.
- Discipline Around Imminent Earnings: With major earnings prints on the immediate horizon (GOOGL tonight, MSFT Wednesday, AMZN Thursday, AAPL next week), holding unhedged directional swing positions through corporate releases presents significant overnight gap risk. Active market participants should emphasize risk-defined ATR boundaries.
- Volatility Buffer Alignment: Maintaining structured 1.5× ATR stop-loss bands and 3.0× ATR profit objectives ensures positions remain insulated from intraday noise while preserving favorable mathematical expectancy across changing market regimes.
DISCLAIMER & TERMS OF USE:
This article is published as part of a general market news and quantitative research series for readers interested in economic and market trends. It is not, and should not be construed as, investment advice, financial advice, trading advice, or a solicitation to buy or sell any financial instruments or securities. Financial markets involve significant risk, and historical market behavior is not indicative of future results. Readers are advised to consult qualified financial professionals before making any financial or investment decisions.