Daily Market Screener Analysis, Technical Setups & Momentum Breakouts – October 24, 2026
An institutional-grade scan across liquid S&P 100 equities analyzing daily momentum shifts, key moving average alignments, stealth volatility bands, and high-impact macro catalysts.
Equities are traversing an eventful macro crosscurrent as institutional allocators recalibrate risk ahead of top-tier economic releases and high-stakes mega-cap technology earnings. In today's quantitative scan across the most liquid S&P 100 constituents, clear sector divergence emerges: energy and defensive leaders are printing fresh relative strength breakouts, while high-beta semiconductor and mega-cap tech franchises digest recent distribution into oversold support zones.
Section 1: Executive Macro Overview & Morning Catalysts
Global capital markets remain intensely focused on incoming growth and inflation metrics against the backdrop of the Federal Reserve's pre-FOMC communications blackout. With benchmark Treasury yields oscillating within recent ranges and the US Dollar Index (DXY) testing multi-week support around 101.50–102.00, macro sensitivity across equity valuation multiples has shifted toward incoming Tier-1 prints: the Core PCE Price Index, Q3 Advance GDP, and October Non-Farm Payrolls.
Simultaneously, Big Tech earnings seasonality is entering its defining phase. The spotlight falls directly on the "hyperscaler" cohort—Microsoft, Alphabet, Meta Platforms, Amazon, and Apple. Investors are scrutinizing enterprise cloud revenue acceleration, capital expenditure efficiency on artificial intelligence infrastructure, and core operating margins. These catalytic announcements present significant gap risk and volatility catalysts across benchmark indices.
Key Macro & Corporate Catalyst Calendar
| Ticker / Asset | Event Type | Scheduled Release Window | Expected Impact | Key Market Focus & Tactical Considerations |
|---|---|---|---|---|
| MACRO / USD | US Core PCE Price Index (MoM / YoY) | Friday (08:30 AM ET) | CRITICAL | The Federal Reserve's primary inflation gauge. An above-consensus print risks pushing benchmark yields higher and compressing equity duration multiples. |
| MACRO / SPX | Advance Q3 GDP & Employment Cost Index | Mid-Week (08:30 AM ET) | HIGH | Measures annualized domestic economic resilience alongside wage inflation trajectory prior to the FOMC rate decision. |
| MACRO / DXY | US Non-Farm Payrolls & Unemployment Rate | First Friday (08:30 AM ET) | CRITICAL | Evaluates labor market stability versus cooling dynamics; average hourly earnings will be scrutinized for persistent wage pressure. |
| FED / RATES | FOMC Pre-Meeting Media Blackout | Active Session | MEDIUM | Official Federal Reserve communication is paused, leaving markets driven purely by fundamental economic data releases. |
| GOOGL | Q3 Earnings Report (Post-Market) | Tuesday (AMC) | HIGH | Search ad resilience, Google Cloud operating margin expansion, and enterprise Gemini infrastructure adoption. |
| MSFT | Q1 FY27 Earnings Report (Post-Market) | Tuesday (AMC) | HIGH | Azure cloud revenue growth rate (constant currency), enterprise Copilot monetization, and forward CapEx guidance. |
| META | Q3 Earnings Report (Post-Market) | Wednesday (AMC) | HIGH | Digital advertising pricing and impression volumes, Reality Labs burn rate, and AI recommendation infrastructure ROI. |
| AMZN | Q3 Earnings Report (Post-Market) | Thursday (AMC) | HIGH | AWS cloud re-acceleration, North American e-commerce operating leverage, and high-margin retail media advertising. |
| AAPL | Q4 FY26 Earnings Report (Post-Market) | Thursday (AMC) | HIGH | iPhone hardware upgrade demand elasticity, Greater China regional revenue trends, and high-margin Services momentum. |
Section 2: Market Overview & Trend Shift Screener Results
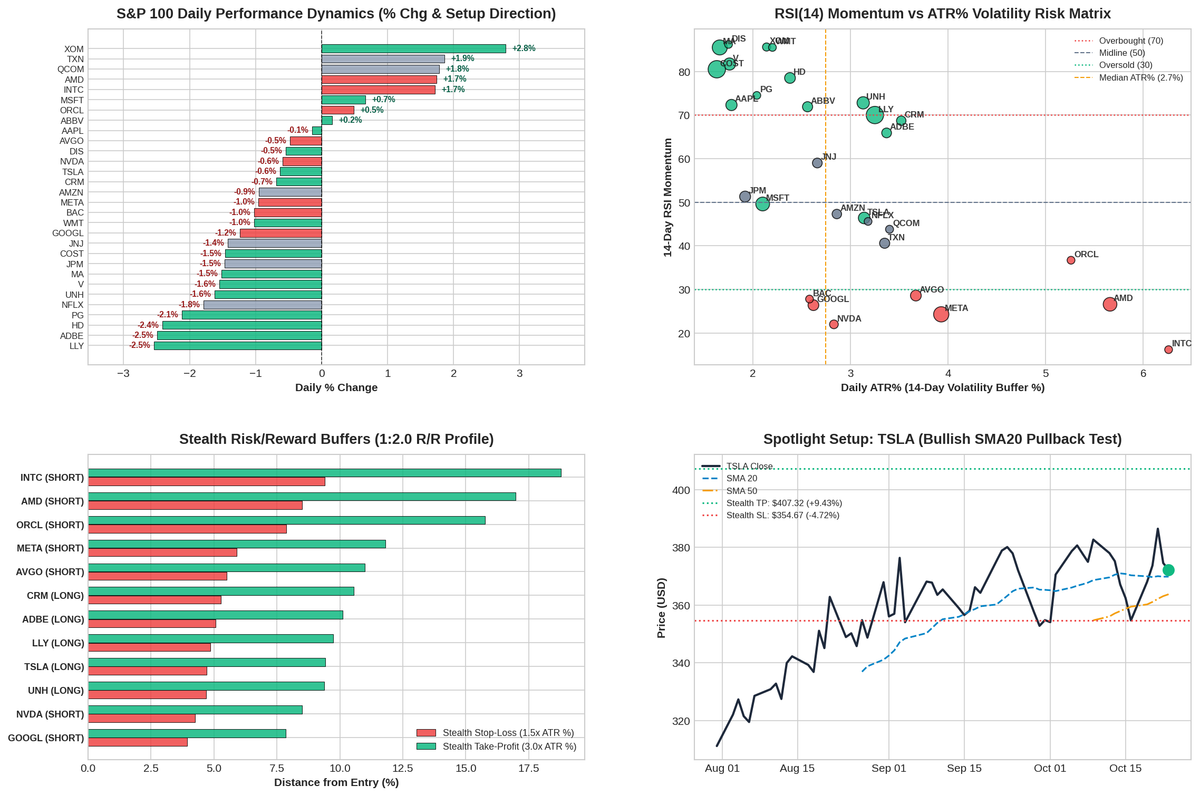
Our quantitative screening model tracks institutional momentum, short-term moving average crossovers (20-day vs. 50-day SMA), 14-day Relative Strength Index (RSI) momentum, and 14-day Average True Range (ATR) volatility bands across the 30 most liquid mega-cap equities in the S&P 100 universe. Volatility buffers are mapped with stealth reference bounds: an invalidation buffer calibrated at 1.5× ATR and a take-profit target at 3.0× ATR, preserving a 1:2.0 reward-to-risk structure.
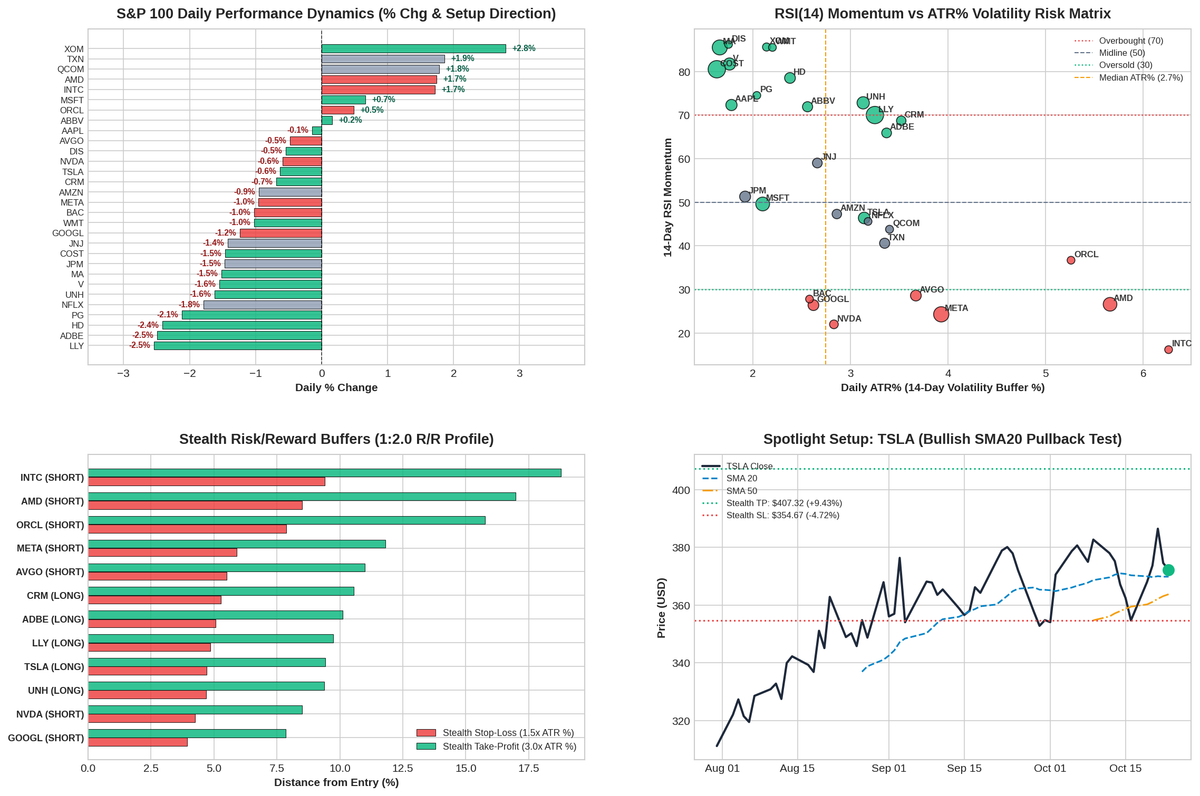
The visual matrix illustrates three prominent structural dynamics:
- Breakout & Golden Cross Formations: Energy and defensive healthcare equities are leading trend expansion, highlighted by Exxon Mobil (XOM) printing a multi-week high breakout and UnitedHealth Group (UNH) confirming a 20/50-day moving average golden cross.
- Pullback Support Tests: Core leaders such as Microsoft (MSFT) and Tesla (TSLA) have completed orderly retracements into their rising 20-day moving averages, holding critical dynamic support.
- Oversold Technology Readings: Leading semiconductor and mega-cap tech equities (NVDA, GOOGL, META, AMD, INTC) have pulled back beneath their short-term moving averages, pushing 14-day RSI readings into compressed territory (16 to 28), signaling potential exhaustion in near-term selling.
Quantitative Screener Technical Matrix
| Ticker | Price ($) | Daily Chg% | SMA 20 ($) | SMA 50 ($) | 14-D RSI | 14-D ATR ($) | ATR Vol% | Setup Classification | Stealth SL ($) | Stealth TP ($) | R/R Ratio |
|---|---|---|---|---|---|---|---|---|---|---|---|
| XOM | $183.21 | +2.79% | $170.85 | $165.76 | 85.6 | $3.93 | 2.14% | Bullish Breakout (20D High) | $177.32 | $194.99 | 1:2.0 |
| MSFT | $524.51 | +0.66% | $526.70 | $508.35 | 49.6 | $11.04 | 2.10% | Bullish SMA20 Pullback Test | $507.95 | $557.63 | 1:2.0 |
| ABBV | $285.64 | +0.16% | $274.02 | $264.74 | 71.9 | $7.31 | 2.56% | Bullish Momentum Continuation | $274.67 | $307.57 | 1:2.0 |
| AAPL | $347.73 | -0.14% | $338.91 | $329.47 | 72.3 | $6.19 | 1.78% | Bullish Momentum Continuation | $338.45 | $366.29 | 1:2.0 |
| TSLA | $372.22 | -0.63% | $369.87 | $363.77 | 46.4 | $11.70 | 3.14% | Bullish SMA20 Pullback Test | $354.67 | $407.32 | 1:2.0 |
| UNH | $418.09 | -1.62% | $389.21 | $387.60 | 72.8 | $13.08 | 3.13% | Bullish Golden Cross (20/50) | $398.46 | $457.34 | 1:2.0 |
| CRM | $248.57 | -0.69% | $235.53 | $234.80 | 68.7 | $8.74 | 3.52% | Bullish Momentum Continuation | $235.46 | $274.79 | 1:2.0 |
| WMT | $119.89 | -1.02% | $112.19 | $109.40 | 85.5 | $2.63 | 2.20% | Bullish Momentum Continuation | $115.94 | $127.79 | 1:2.0 |
| COST | $1,003.32 | -1.46% | $958.15 | $938.86 | 80.5 | $16.40 | 1.63% | Bullish Momentum Continuation | $978.72 | $1,052.53 | 1:2.0 |
| MA | $623.60 | -1.52% | $589.81 | $580.98 | 85.5 | $10.38 | 1.66% | Bullish Momentum Continuation | $608.04 | $654.73 | 1:2.0 |
| V | $407.92 | -1.55% | $385.26 | $377.07 | 81.7 | $7.18 | 1.76% | Bullish Momentum Continuation | $397.15 | $429.46 | 1:2.0 |
| LLY | $1,273.46 | -2.54% | $1,204.94 | $1,186.60 | 70.0 | $41.34 | 3.25% | Bullish Momentum Continuation | $1,211.45 | $1,397.47 | 1:2.0 |
| NVDA | $210.96 | -0.59% | $225.54 | $222.39 | 22.0 | $5.98 | 2.83% | Bearish Distribution / Oversold | $219.93 | $193.03 | 1:2.0 |
| GOOGL | $320.21 | -1.24% | $343.08 | $342.88 | 26.4 | $8.39 | 2.62% | Bearish Distribution Below SMA20 | $332.79 | $295.05 | 1:2.0 |
| META | $642.62 | -0.96% | $717.65 | $663.58 | 24.3 | $25.28 | 3.93% | Bearish Distribution Below SMA50 | $680.55 | $566.77 | 1:2.0 |
| AVGO | $321.68 | -0.48% | $348.71 | $356.43 | 28.6 | $11.79 | 3.67% | Bearish Trend Below SMAs | $339.36 | $286.31 | 1:2.0 |
| INTC | $86.96 | +1.72% | $104.09 | $102.11 | 16.2 | $5.45 | 6.26% | Deep Oversold Mean-Reversion Zone | $95.13 | $70.62 | 1:2.0 |
| AMD | $516.79 | +1.74% | $587.22 | $542.28 | 26.6 | $29.27 | 5.66% | Bearish Compression Below SMAs | $560.70 | $428.97 | 1:2.0 |
| AMZN | $248.00 | -0.95% | $254.43 | $255.65 | 47.3 | $7.08 | 2.86% | Neutral Compression / Squeeze | $237.38 | $269.24 | 1:2.0 |
| JPM | $331.58 | -1.47% | $333.20 | $344.16 | 51.3 | $6.37 | 1.92% | Midline Consolidation | $322.03 | $350.69 | 1:2.0 |
Section 3: Tactical Setup & Momentum Spotlights
1. Fresh Bullish Breakouts: Exxon Mobil (XOM)
Exxon Mobil (NYSE: XOM) demonstrated decisive relative strength, breaking cleanly above its prior 20-day high to close at $183.21 (+2.79%). The move is backed by constructive trend alignment, with the stock trading comfortably above its rising 20-day ($170.85) and 50-day ($165.76) moving averages. Despite a firm momentum reading (RSI 85.6), daily volatility remains measured at an ATR of $3.93 (2.14% of price). Technical support invalidation sits near $177.30, with upper expansion targets opening toward the psychological $195.00 resistance corridor.
2. Golden Cross Formation: UnitedHealth Group (UNH)
Healthcare bellwether UnitedHealth Group (NYSE: UNH) printed a classic 20/50-day SMA Golden Cross, with its 20-day moving average crossing above the 50-day benchmark ($389.21 vs. $387.60). Closing at $418.09, UNH has successfully absorbed its post-earnings supply overhang. The technical structure remains robust above the $398.50 zone, with forward upside targets projected toward $457.00 based on measured wave projections.
3. Pullback Re-Tests at Dynamic Support: Microsoft (MSFT) & Tesla (TSLA)
Both Microsoft ($524.51) and Tesla ($372.22) concluded orderly multi-session pullbacks directly into their upward-sloping 20-day moving averages. Microsoft's RSI has normalized to a neutral 49.6 with daily ATR at $11.04 (2.10%), establishing key dynamic support between $508.00 and $515.00. Tesla similarly defended its $369.80 moving average anchor, exhibiting ATR volatility of $11.70 (3.14%) and maintaining an upside technical objective toward $407.30.
4. Oversold Compression Watch: Semis & Mega-Cap Tech (NVDA, GOOGL, META)
A notable tactical divergence is unfolding across the semiconductor and mega-cap tech cohort. NVIDIA ($210.96, RSI 22.0), Alphabet ($320.21, RSI 26.4), and Meta Platforms ($642.62, RSI 24.3) have experienced sustained selling below their short-term moving average ribbons. While their primary intermediate trends warrant caution ahead of earnings, acute oversold readings suggest that downside momentum is decelerating, elevating the probability of sharp mean-reversion short-covering rallies if macro catalysts print benignly.
Section 4: Daily Market Outlook & Tactical Takeaways
Today's screening landscape paints a nuanced picture of a two-speed market. Broad index resilience is being anchored by defensive healthcare, consumer staples, and cash-flow-rich energy giants, offsetting corrective price action in high-multiple technology equities.
Key Tactical Guidelines for Active Traders:
- Respect Volatility Buffers: With daily ATR percentages ranging from an ultra-tight 1.6%–2.2% in defensive leaders (COST, WMT, XOM) to elevated 5.5%–6.3% swings in high-beta chips (AMD, INTC), position sizing should dynamically reflect underlying volatility rather than fixed share quantities.
- Differentiate Trend Pullbacks from Breakdowns: Names testing rising 20-day moving averages from above (e.g., MSFT, TSLA) present structurally superior risk-reward profiles compared to equities breaking down below declining moving average ribbons.
- Manage Pre-Earnings Event Risk: With hyperscalers scheduled to report throughout the week, directional gap risk remains heightened. Professional market participants prioritize risk preservation by avoiding over-leveraged exposure across binary earnings announcements.
DISCLAIMER & TERMS OF USE:
This article is published as part of a general market news and quantitative research series for readers interested in economic and market trends. It is not, and should not be construed as, investment advice, financial advice, trading advice, or a solicitation to buy or sell any financial instruments or securities. Financial markets involve significant risk, and historical market behavior is not indicative of future results. Readers are advised to consult qualified financial professionals before making any financial or investment decisions.