Daily Market Screener Analysis, Technical Setups & Momentum Breakouts – October 23, 2026
A deep dive into daily price dynamics, momentum shifts, and technical breakout setups across the S&P 100 universe for October 23, 2026. Featuring quantitative screening tables, institutional volatility buffers, and macro catalyst analysis.
A screening across top liquid U.S. equities reveals sharp sector divergence and institutional rotation. While mega-cap technology and high-beta semiconductor leaders face systematic de-risking, defensive stalwarts, consumer staples, and global payments networks are driving fresh multi-month breakout setups.
1. Executive Macro Overview & Morning Catalysts
The macroeconomic backdrop remains defined by resilient labor conditions, balanced growth indicators, and persistent geopolitical friction in energy markets. With the 10-Year U.S. Treasury yield hovering just beneath psychological resistance levels, equity markets are witnessing heightened dispersion between capital-intensive growth and resilient, cash-generative anchors.
Labor data printed firmer than expected this morning, with Initial Jobless Claims dropping to 194,000 against consensus projections of 200,000. Low continuing claims reinforce that institutional payrolls remain well-supported, sustaining the "higher-for-longer" policy narrative ahead of next week's central bank gatherings. Concurrently, existing home sales staged a modest recovery (+1.5% MoM), indicating transactional stability despite elevated borrowing costs.
Corporate earnings season is accelerating the pace of single-stock dispersion. Procter & Gamble (PG) posted an impressive margin beat and organic volume expansion, catalyzing immediate capital flows into consumer staples, while industrial and financial heavyweights like Union Pacific and Blackstone reported solid underlying operating metrics.
Macro & Corporate Catalyst Calendar
| Ticker / Asset | Event Type | Scheduled Release Time (ET) | Expected Impact | Key Market Focus |
|---|---|---|---|---|
| USD / Macro | Initial Jobless Claims | 08:30 AM ET | High | Reported 194K vs. 200K consensus; confirms labor market resilience. |
| USD / Macro | Continuing Claims | 08:30 AM ET | Medium | Subdued claims turnover validates low structural unemployment. |
| USD / Housing | Existing Home Sales (Sep) | 10:00 AM ET | Medium | Rebounded +1.5% MoM, demonstrating inventory stabilization. |
| USD / Growth | Conference Board LEI (Sep) | 10:00 AM ET | Medium | Printed flat (0.0% MoM); points to continued late-cycle expansion. |
| PG | Q1 Earnings Release | Pre-Market (BMO) | High | Strong volume and pricing power drove a +5.9% equity surge. |
| UNP | Q3 Earnings Release | Pre-Market (BMO) | Medium | Industrial carload volumes and freight pricing power durability. |
| BX | Q3 Earnings Release | Pre-Market (BMO) | Medium | Fee-related earnings (FRE) and private credit capital deployment. |
| LMT | Q3 Earnings Release | Post-Close (AMC) | High | Munitions backlog delivery and defense expenditure visibility. |
| WDC | Q1 Earnings Release | Post-Close (AMC) | High | Enterprise SSD/NAND pricing cycles amid semiconductor de-rating. |
2. Market Overview & Trend Shift Screener Results
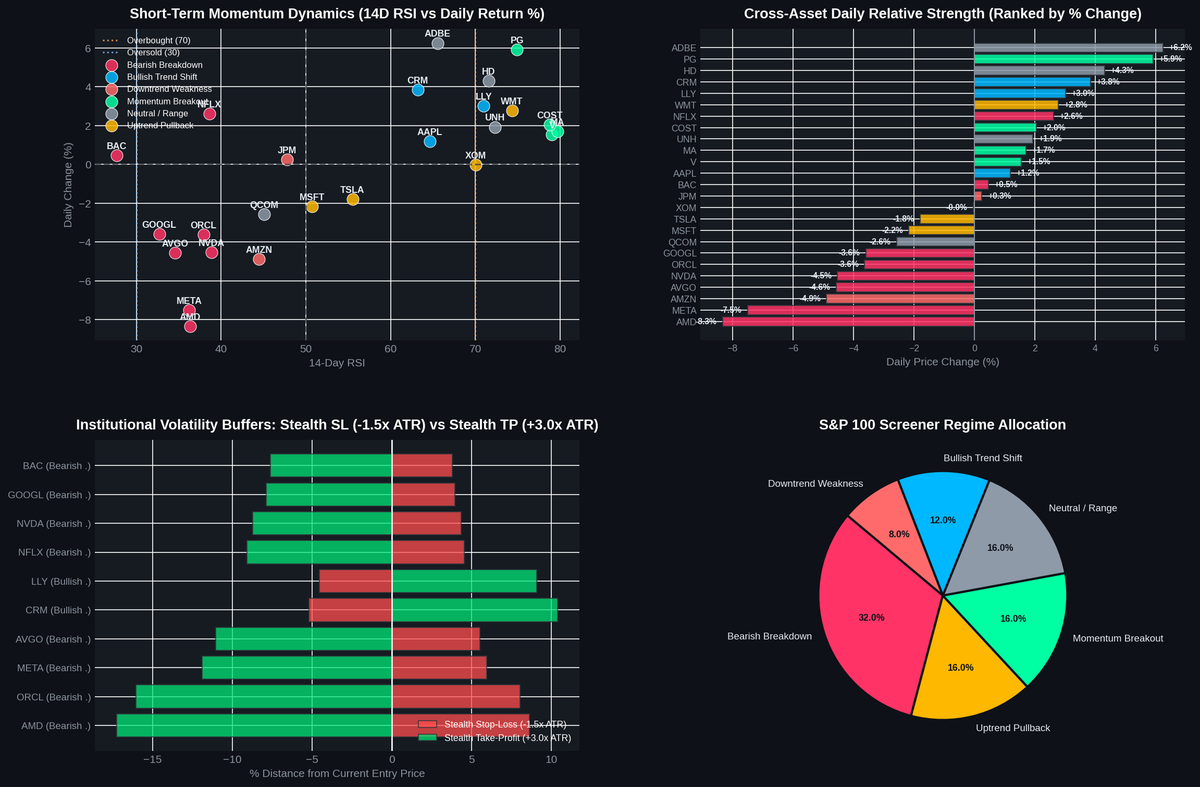
Today’s quantitative scan of the S&P 100 universe highlights clear regime bifurcation. Daily trend shifts were characterized by aggressive de-grossing across semiconductor hardware (AMD -8.33%, META -7.50%, AVGO -4.57%, NVDA -4.52%), pushing these former high-flyers below intermediate 20-day simple moving averages into technical breakdown territory.
Conversely, payments networks (Visa, Mastercard) and staples leaders (Costco, Procter & Gamble) recorded decisive 20-day high breakouts supported by accelerating 14-day RSI momentum (>70) and structurally low daily volatility (ATR < 2.0%).
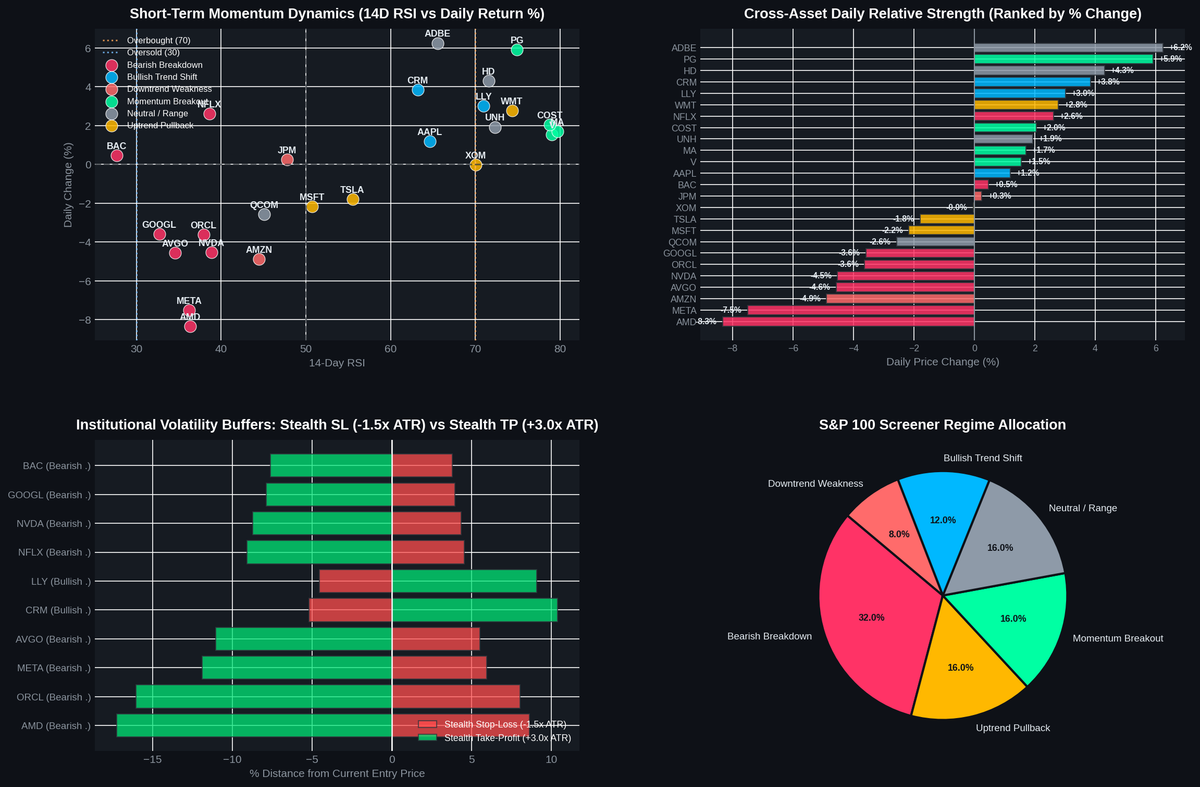
S&P 100 Multi-Asset Technical Screener
The table below summarizes technical posture, moving average status, 14-day RSI, daily ATR volatility, and stealth risk brackets modeled using 1.5x ATR for technical support invalidation and 3.0x ATR for trend extension targets (1:2.0 risk-reward profile):
| Ticker | Price ($) | Daily Return | 14D RSI | 14D ATR ($) | ATR Vol % | Setup Classification | Bias | Stealth SL (1.5x ATR) | Stealth TP (3.0x ATR) | R/R Ratio |
|---|---|---|---|---|---|---|---|---|---|---|
| V | $414.15 | +1.55% | 79.06 | 7.44 | 1.80% | Momentum Breakout | LONG | $403.00 | $436.46 | 1:2.0 |
| MA | $633.20 | +1.70% | 79.68 | 10.45 | 1.65% | Momentum Breakout | LONG | $617.52 | $664.56 | 1:2.0 |
| COST | $1,018.76 | +2.05% | 78.81 | 15.81 | 1.55% | Momentum Breakout | LONG | $995.04 | $1,066.20 | 1:2.0 |
| PG | $166.12 | +5.92% | 74.93 | 3.15 | 1.90% | Momentum Breakout | LONG | $161.39 | $175.58 | 1:2.0 |
| AAPL | $348.07 | +1.19% | 64.63 | 6.08 | 1.75% | Bullish Trend Shift | LONG | $338.95 | $366.31 | 1:2.0 |
| LLY | $1,309.04 | +3.01% | 71.00 | 39.62 | 3.03% | Bullish Trend Shift | LONG | $1,249.61 | $1,427.89 | 1:2.0 |
| CRM | $251.07 | +3.84% | 63.21 | 8.68 | 3.46% | Bullish Trend Shift | LONG | $238.04 | $277.12 | 1:2.0 |
| MSFT | $521.41 | -2.17% | 50.72 | 11.38 | 2.18% | Uptrend Pullback | LONG | $504.34 | $555.55 | 1:2.0 |
| TSLA | $379.55 | -1.79% | 55.50 | 12.03 | 3.17% | Uptrend Pullback | LONG | $361.50 | $415.64 | 1:2.0 |
| WMT | $121.07 | +2.78% | 74.33 | 2.52 | 2.08% | Uptrend Pullback | LONG | $117.29 | $128.63 | 1:2.0 |
| AMD | $506.69 | -8.33% | 36.32 | 29.12 | 5.75% | Bearish Breakdown | SHORT | $550.38 | $419.32 | 1:2.0 |
| META | $645.23 | -7.50% | 36.25 | 25.57 | 3.96% | Bearish Breakdown | SHORT | $683.58 | $568.52 | 1:2.0 |
| AVGO | $322.37 | -4.57% | 34.55 | 11.88 | 3.69% | Bearish Breakdown | SHORT | $340.19 | $286.73 | 1:2.0 |
| NVDA | $211.93 | -4.52% | 38.87 | 6.16 | 2.90% | Bearish Breakdown | SHORT | $221.16 | $193.46 | 1:2.0 |
| GOOGL | $322.74 | -3.59% | 32.69 | 8.48 | 2.63% | Bearish Breakdown | SHORT | $335.47 | $297.29 | 1:2.0 |
| ORCL | $124.45 | -3.63% | 37.92 | 6.66 | 5.35% | Bearish Breakdown | SHORT | $134.43 | $104.47 | 1:2.0 |
| AMZN | $249.55 | -4.89% | 44.46 | 7.11 | 2.85% | Downtrend Weakness | SHORT | $260.22 | $228.20 | 1:2.0 |
3. Tactical Setup & Momentum Spotlights
1. Fresh Bullish Breakouts (High Relative Strength)
Visa (V) & Mastercard (MA): Institutional Accumulation Across Payment Rails
Both global payment networks cleared significant multi-week resistance levels simultaneously. Visa posted a fresh high at $414.15 (+1.55%) with a 14-day RSI of 79.06, while Mastercard printed $633.20 (+1.70%). The primary catalyst remains stable cross-border consumer spending and transaction volume resilience. Technical invalidation sits at $403.00 for Visa and $617.52 for Mastercard, providing favorable asymmetric targets toward $436.46 and $664.56 respectively.
Costco Wholesale (COST): Steady Structural Trend Expansion
Costco decisively crossed the four-figure mark to trade at $1,018.76 (+2.05%). Supported by an ATR volatility profile of just 1.55%, the stock continues to ride its 20-day moving average upward. Pullbacks toward the $995.00 handle offer structured reference support for trend-following strategies.
2. Momentum Leaders & Trend Continuation
Procter & Gamble (PG): Post-Earnings Momentum Driver
PG experienced a powerful +5.92% surge to $166.12 following its quarterly earnings release, breaking out of a three-month consolidation base. With 14-day RSI accelerating to 74.93 and daily ATR expanding moderately to $3.15, price action reflects heavy institutional accumulation. Defined downside invalidation aligns near $161.40.
Apple (AAPL) & Eli Lilly (LLY): Resilient Capital Anchors
While broader mega-cap technology retreated, Apple held firm (+1.19% to $348.07), maintaining an intact moving average structure above its 20-day SMA ($339.80). Eli Lilly gained +3.01% to $1,309.04, reclaiming leadership within the healthcare sector.
3. Bearish Trend Continuations & Relative Weakness
Advanced Micro Devices (AMD) & Meta Platforms (META): Distribution and De-Grossing
Semiconductors and hyperscalers suffered notable liquidation pressure. AMD tumbled -8.33% to $506.69, violating its 20-day moving average with daily ATR spiking to $29.12 (5.75% of spot price). Meta similarly fell -7.50% to $645.23, sliding below short-term support. Until daily RSI levels (both near 36) stabilize and price action builds a consolidation floor, counter-trend dip buying remains higher risk.
4. Volatility Compression / Consolidation Watch
Microsoft (MSFT) & Tesla (TSLA): Testing Structural Moving Averages
Microsoft drifted lower by -2.17% to $521.41, but continues to trade comfortably above its upward-sloping 50-day moving average. The pullback represents an orderly mean-reversion with RSI resetting to 50.72. Tesla consolidated around $379.55 (-1.79%), maintaining a constructive range above the $361.50 support cluster.
4. Daily Market Outlook & Tactical Takeaways
Today’s session highlights a classic late-cycle rotation where market participants are unwinding crowded high-beta semiconductor positions in favor of cash-generative value, consumer staples, and financial transaction platforms. Market breadth under the surface reveals healthy underlying participation despite headwind pressure on index-weighted mega-caps.
Key tactical takeaways for active market participants:
- Respect Volatility Expansion in Beta: With tech and AI leaders experiencing ATR expansion exceeding 4% to 5% of spot, position sizing must adjust dynamically to accommodate wider intraday swings.
- Follow Relative Strength Inflows: Strong relative performance in staples and payments underscores institutional commitment. Look for shallow pullbacks toward 20-day moving averages as constructive re-entry zones.
- Maintain Strict Risk Discipline: Pre-defining clear volatility-based support invalidation levels (such as 1.5x ATR) protects capital against sudden macro shifts, while scaling out near 3.0x ATR extension targets captures favorable risk-adjusted returns.
DISCLAIMER & TERMS OF USE:
This article is published as part of a general market news and quantitative research series for readers interested in economic and market trends. It is not, and should not be construed as, investment advice, financial advice, trading advice, or a solicitation to buy or sell any financial instruments or securities. Financial markets involve significant risk, and historical market behavior is not indicative of future results. Readers are advised to consult qualified financial professionals before making any financial or investment decisions.